Market Outlook
July 26, 2017
Market Cues
Domestic Indices
Chg (%)
(Pts)
(Close)
Indian markets are likely to open flat tracking global indices and SGX Nifty.
BSE Sensex
(0.1)
(18)
32,228
US markets closed higher on Tuesday after a slew of major companies reported
Nifty
(0.0)
(2)
9,965
better-than-expected quarterly results. The S&P 500 rose 0.3% to hit intraday and
Mid Cap
0.6
86
15,313
closing records, with financials, materials and energy rising more than 1% to lead
Small Cap
0.1
118
16,054
advancers. The index closed at 2,477. The Dow Jones industrial average rose 100.3
points to close at 21,613, with Caterpillar and McDonald's contributing the most
Bankex
0.4
122
27,757
gains. The Nasdaq composite rose just 0.02% but managed intraday and closing
records. The index finished the session at 6,412.
Global Indices
Chg (%)
(Pts)
(Close)
The European markets ended Tuesday's session in the green, putting an end to a
Dow Jones
0.5
100
21,613
three session losing streak. Investors were encouraged by the stronger than
Nasdaq
0.0
51
6,412
expected business confidence data from Germany and by the progress that is being
FTSE
0.8
57
7,435
made in Greece.
Nikkei
(0.1)
(20)
19,955
Indian markets ended a choppy session on a flat note on Tuesday ahead of the two-
Hang Seng
0.0
235
26,852
day policy meeting of the Federal Reserve starting later today. The Fed is widely
Shanghai Com
(0.2)
(7)
3,244
expected to leave interest rates unchanged but investors will be looking for clues on
whether the U.S. central bank will raise interest rates again this year.
Advances / Declines
BSE
NSE
Result update
Advances
1,210
1,748
Review: Axis Bank
Declines
1,503
952
Unchanged
150
77
Detailed analysis is on Pg2
Investor’s Ready Reckoner
Volumes (` Cr)
Key Domestic & Global Indicators
BSE
4,090
Stock Watch: Latest investment recommendations on 150+ stocks
NSE
25,651
Refer Pg7 onwards
#Net Inflows (` Cr)
Net
Mtd
Ytd
Top Picks
CMP
Target
Upside
Company
Sector
Rating
FII
(5(102)
( 1,420
57,328
(`)
(`)
(%)
MFs
804
98
4,990
44,136
Blue Star
Capital Goods
Accumulate
706
760
7.7
Dewan Housing FinanceFinancials
Accumulate
463
520
12.4
Mahindra Lifespace
Real Estate
Buy
433
522
20.7
Top Gainers
Price (`)
Chg (%)
Navkar Corporation
Others
Buy
203
265
30.5
Renuka
122
11.6
KEI Industries
Capital Goods
Accumulate
231
258
11.5
More Top Picks on Pg5
M&Mfin
399
9.8
Unitech
9
8.7
Key Upcoming Events
Idea
98
6.5
Previous
Consensus
Date
Region
Event Description
Reading
Expectations
Network18
58
5.2
Jul 26, 2017
UK
GDP (YoY)
2.00
1.70
Jul 26, 2017
US
FOMC rate decision
1.25
1.25
Top Losers
Price (`)
Chg (%)
Jul 26, 2017
US
New home sales
610.00
615.00
Strtech
216
(6.8)
Jul 27, 2017
US
Initial Jobless claims
233.00
240.00
Jul 28, 2017
China
PMI Manufacturing
51.70
51.50
Fconsumer
42
(5.0)
More Events on Pg7
Videoind
25
(4.8)
Sreinfra
129
(3.1)
Jpassociat
27
(3.1)
#as on 25t July, 2017
Market Outlook
July 26, 2017
Result Review
Slippages from non watch list goes up, but core operations
remains fairly decent for Axis Bank
Axis Bank’s headline numbers remained in line with expectations. As expected
retail loans continued to drive the growth during the quarter as well, up 22.4%.
Growth in Corporate loans continued to be muted up by only 2.6% YoY. Asset
quality of the bank remained largely stable due to lower slippages at Rs 3519 cr vs
Rs 4811 cr. Slippages from the non watch list portfolio has gone up during the
quarter. However, part of incremental retail slippages came from the agri related
portfolio, which can be considered one off and hence we don’t expect material
change in the credit cost. Though slippages outside watch list can be a cause of
concern the management has re-iterated its stand that credit cost will not exceed
225 bps for FY18 and that gives a confidence that large part of the trouble for Axis
Bank might be behind now. The core operations of the bank remain fairly decent
and hence we have an ACCMULATE rating on the stock.
Economic and Political News
Rupee sheds 4 paise, ends at 64.38 as on heavy dollar buying ahead of
FOMC
RBI may cut repo rate by 25 bps in August policy review: ICRA
Govt needs `7 lakh cr investment in 5 yrs for highway development
Corporate News
Geojit Fin Services Q1 net up 35% at `16cr on robust capital markets
Mahindra Lifespaces Q1 net dips to `14cr on regulatory changes
ICICI Prudential Life Q1 net profit flat at `406cr
Market Outlook
July 26, 2017
Quarterly Bloomberg Brokers Consensus Estimate
Yes Bank Ltd - July 26, 2017
Particulars ( ` cr)
1QFY18E
1QFY17
y-o-y (%)
4QFY17 q-o-q (%)
Net profit
925
732
26.4
914
1.2
Nestle India Ltd. - July 26, 2017
Particulars ( ` cr)
1QFY18E
1QFY17
y-o-y (%)
4QFY17 q-o-q (%)
Net sales
2,451
2,256
8.6
2,476
(1.0)
EBITDA
453
435
4.1
525
(13.7)
EBITDA margin (%)
18.5
19.3
21.2
Net profit
292
252
16.2
307
(4.7)
HDFC Finance Housing - July 26, 2017
Particulars ( ` cr)
1QFY18E
1QFY17
y-o-y (%)
4QFY17 q-o-q (%)
Net profit
1792
1870
(4.2)
2044
(12.3)
Market Outlook
July 26, 2017
Top Picks ★★★★★
Market Cap
CMP
Target
Upside
Company
Rationale
(` Cr)
(`)
(`)
(%)
Strong growth in domestic business due to its leadership
in acute therapeutic segment. Alkem expects to launch
Alkem Laboratories
21,791
1,823
2,161
18.6
more products in USA, which bodes for its international
business.
We expect the company would report strong profitability
Asian Granito
1,257
418
480
14.9
owing to better product mix, higher B2C sales and
amalgamation synergy.
Favourable outlook for the AC industry to augur well for
Cooling products business which is out pacing the
Blue Star
6,756
706
760
7.7
market growth. EMPPAC division's profitability to improve
once operating environment turns around.
With a focus on the low and medium income (LMI)
consumer segment, the company has increased its
Dewan Housing Finance
14,503
463
520
12.4
presence in tier-II & III cities where the growth
opportunity is immense.
Loan growth is likely to pick up after a sluggish FY17.
Karur Vysya Bank
8,340
138
160
15.9
Lower credit cost will help in strong bottomline growth.
Increasing share of CASA will help in NIM improvement.
High order book execution in EPC segment, rising B2C
KEI Industries
1,800
231
258
11.5
sales and higher exports to boost the revenues and
profitability
Speedier execution and speedier sales, strong revenue
Mahindra Lifespace
2,220
433
522
20.7
visibilty in short-to-long run, attractive valuations
Massive capacity expansion along with rail advantage at
Navkar Corporation
2,895
203
265
30.5
ICD as well CFS augurs well for the company
Strong brands and distribution network would boost
Siyaram Silk Mills
2,176
2,321
2,500
3.0
growth going ahead. Stock currently trades at an
inexpensive valuation.
Market leadership in Hindi news genre and no.
2
viewership ranking in English news genre, exit from the
TV Today Network
1,480
248
344
38.7
radio business, and anticipated growth in ad spends by
corporates to benefit the stock.
After GST, the company is expected to see higher
volumes along with improving product mix. The Gujarat
Maruti
2,27,009
7,515
8,495
13.0
plant will also enable higher operating leverage which
will be margin accretive.
Source: Company, Angel Research,
Market Outlook
July 26, 2017
Key Upcoming Events
Result Calendar
Date
Company
Jul 25, 2017
Hero Motocorp, FAG Bearings, Areva, Axis Bank, Asian Paints, Sesa Goa, GSK Pharma
Jul 26, 2017
HDFC, Yes Bank, Nestle, PVR, Siyaram Silk Mills, Radico Khaitan
Jul 27, 2017
Maruti, ICICI Bank, Reliance Capital, ITC, HCL Tech, ONGC, Dr Reddy's, Glenmark Pharma.
Source: Bloomberg, Angel Research
Global economic events release calendar
Date
Time
Country
Event Description
Unit
Period
Bloomberg Data
Last Reported Estimated
Jul 26, 2017
2:00PM
UK
GDP (YoY)
% Change
2Q A
2.00
1.70
11:30PM
US
FOMC rate decision
%
Jul 26
1.25
1.25
7:30PM
US
New home sales
Thousands
Jun
610.00
615.00
Jul 27, 2017
6:00PM
US
Initial Jobless claims
Thousands
Jul 22
233.00
240.00
Jul 28, 2017
6:30AM
China
PMI Manufacturing
Value
Jul
51.70
51.50
2:30PM
Euro Zone
Euro-Zone Consumer Confidence
Value
Jul F
(1.70)
(1.70)
Jul 31, 2017
6:00PM
US
GDP Qoq (Annualised)
% Change
2Q A
1.40
2.50
Aug 1, 2017
1:25PM
Germany
PMI Manufacturing
Value
Jul F
58.30
--
1:25PM
Germany
Unemployment change (000's)
Thousands
Jul
7.00
--
2:00PM
UK
PMI Manufacturing
Value
Jul
54.30
--
2:30PM
Euro Zone
Euro-Zone GDP s.a. (QoQ)
% Change
2Q A
0.60
--
Aug 2, 2017
2:30PM
India
RBI Reverse Repo rate
%
Aug 2
6.00
5.75
2:30PM
India
RBI Repo rate
%
Aug 2
6.25
6.00
2:30PM
India
RBI Cash Reserve ratio
%
Aug 2
4.00
4.00
Aug 3, 2017
1:25PM
Germany
PMI Services
Value
Jul F
53.50
--
4:30PM
UK
BOE Announces rates
% Ratio
Aug 3
0.25
0.25
Aug 4, 2017
6:00PM
US
Unnemployment rate
%
Jul
4.40
4.30
6:00PM
US
Change in Nonfarm payrolls
Thousands
Jul
222.00
178.00
Aug 8, 2017
China
Exports YoY%
% Change
Jul
11.30
--
Aug 9, 2017
7:00AM
China
Consumer Price Index (YoY)
% Change
Jul
1.50
--
Aug 10, 2017
India
Imports YoY%
% Change
Jul
19.00
--
India
Exports YoY%
% Change
Jul
4.40
--
Source: Bloomberg, Angel Research
Market Outlook
July 26, 2017
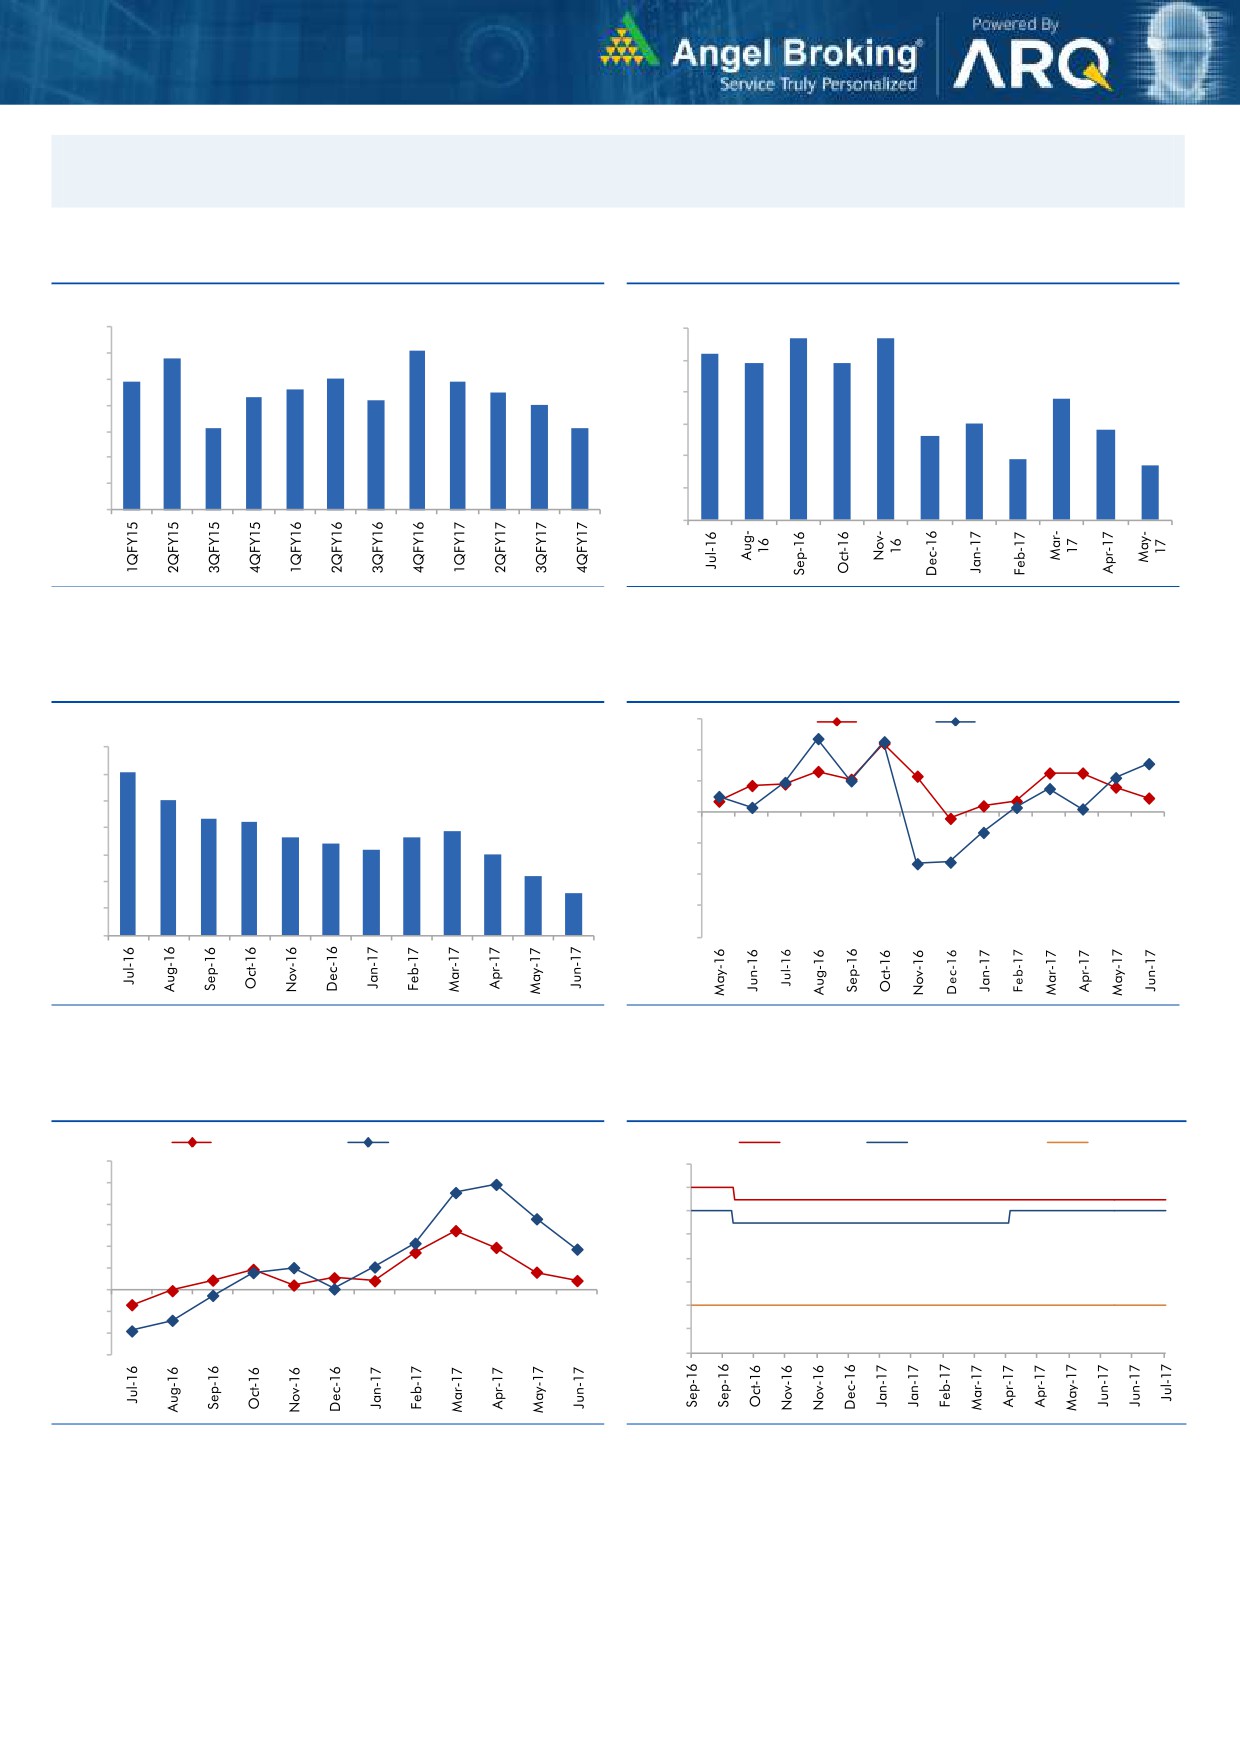
Macro watch
Exhibit 1: Quarterly GDP trends
Exhibit 2: IIP trends
(%)
(%)
5.7
5.7
10.0
6.0
9.1
5.2
8.8
4.9
4.9
9.0
7.9
8.0
7.9
5.0
7.6
7.5
8.0
7.3
7.2
3.8
7.0
4.0
7.0
3.0
6.1
6.1
2.8
2.6
3.0
6.0
1.9
1.7
5.0
2.0
4.0
1.0
3.0
-
Source: CSO, Angel Research
Source: MOSPI, Angel Research
Exhibit 3: Monthly CPI inflation trends
Exhibit 4: Manufacturing and services PMI
56.0
Mfg. PMI
Services PMI
(%)
7.0
54.0
6.1
6.0
5.1
52.0
5.0
4.3
4.2
3.9
50.0
3.6
3.7
4.0
3.4
3.2
3.0
48.0
3.0
2.2
1.5
46.0
2.0
1.0
44.0
-
42.0
Source: MOSPI, Angel Research
Source: Market, Angel Research; Note: Level above 50 indicates expansion
Exhibit 5: Exports and imports growth trends
Exhibit 6: Key policy rates
(%)
Exports yoy growth
Imports yoy growth
(%)
Repo rate
Reverse Repo rate
CRR
60.0
7.00
50.0
6.50
40.0
6.00
30.0
5.50
20.0
5.00
10.0
4.50
0.0
4.00
(10.0)
(20.0)
3.50
(30.0)
3.00
Source: Bloomberg, Angel Research
Source: RBI, Angel Research
Market Outlook
July 26, 2017
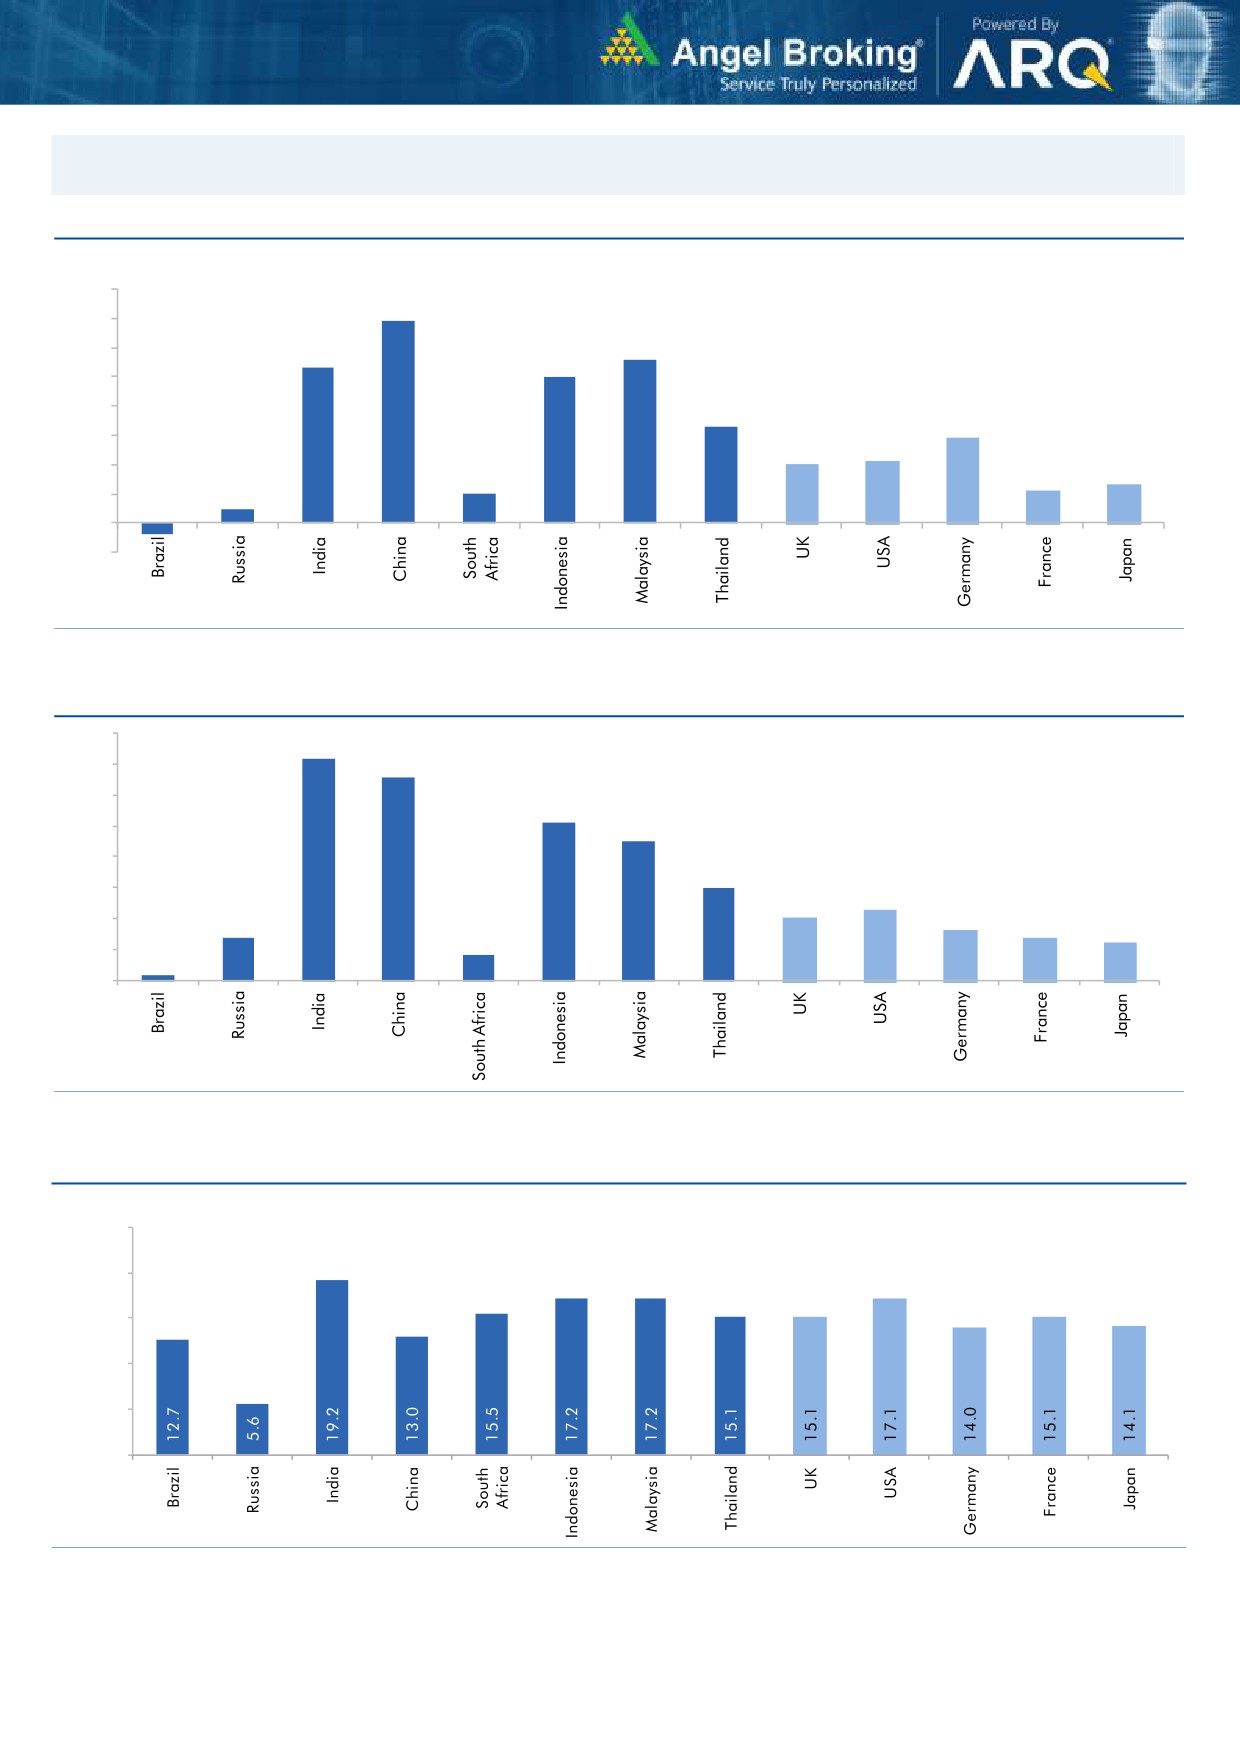
Global watch
Exhibit 1: Latest quarterly GDP Growth (%, yoy) across select developing and developed countries
(%)
8.0
6.9
7.0
5.6
6.0
5.3
5.0
1.0
5.0
4.0
3.3
2.9
3.0
2.0
2.1
2.0
0.5
1.1
1.3
1.0
-
(1.0)
(0.4)
Source: Bloomberg, Angel Research
Exhibit 2: 2016 GDP Growth projection by IMF (%, yoy) across select developing and developed countries
(%)
7.2
6.6
7.0
6.0
5.1
5.0
4.5
4.0
3.0
3.0
2.3
2.0
1.4
1.6
2.0
1.4
1.2
0.2
0.8
1.0
-
Source: IMF, Angel Research
Exhibit 3: One year forward P-E ratio across select developing and developed countries
(x)
25.0
20.0
15.0
10.0
5.0
-
Source: IMF, Angel Research
Market Outlook
July 26, 2017
Exhibit 4: Relative performance of indices across globe
Returns (%)
Country
Name of index
Closing price
1M
3M
1YR
Brazil
Bovespa
65,100
6.2
2.1
15.1
Russia
Micex
1,932
2.9
(0.6)
(0.9)
India
Nifty
9,966
3.5
8.1
16.3
China
Shanghai Composite
3,251
2.7
2.2
6.0
South Africa
Top 40
48,058
6.6
6.2
4.4
Mexico
Mexbol
51,666
5.4
4.6
9.6
Indonesia
LQ45
973
0.6
4.2
11.9
Malaysia
KLCI
1,762
(1.1)
1.2
5.6
Thailand
SET 50
1,001
1.1
1.0
4.9
USA
Dow Jones
21,513
0.5
4.7
16.3
UK
FTSE
7,378
(0.8)
3.7
9.7
Japan
Nikkei
19,976
(0.8)
8.4
21.9
Germany
DAX
12,209
(3.6)
(1.5)
18.7
France
CAC
5,128
(1.6)
(1.8)
19.8
Source: Bloomberg, Angel Research, #Data as on 25th July
Stock Watch
July 26, 2017
Company Name
Reco
CMP
Target
Mkt Cap
Sales ( Čcr )
OPM(%)
EPS (Č)
PER(x)
P/BV(x)
RoE(%)
EV/Sales(x)
(Č)
Price ( Č)
( Č cr )
FY17E
FY18E
FY17E
FY18E
FY17E
FY18E
FY17E
FY18E
FY17E
FY18E
FY17E
FY18E
FY17E
FY18E
Agri / Agri Chemical
Rallis
Reduce
240
209
4,669
1,937
2,164
13.3
14.3
9.0
11.0
26.7
21.8
4.6
4.1
18.4
19.8
2.4
2.1
United Phosphorus
Neutral
884
-
44,913
15,176
17,604
18.5
18.5
37.4
44.6
23.6
19.8
4.6
3.8
21.4
21.2
3.0
2.6
Auto & Auto Ancillary
Amara Raja Batteries
Accumulate
847
962
14,461
5,339
6,220
15.9
15.3
28.0
32.3
30.2
26.2
5.8
4.9
19.1
18.5
2.7
2.3
Apollo Tyres
Neutral
265
-
13,479
12,877
14,504
14.3
13.9
21.4
23.0
12.4
11.5
1.9
1.7
16.4
15.2
1.2
1.1
Ashok Leyland
Accumulate
105
116
30,699
20,019
22,789
11.1
11.7
4.3
5.5
24.4
19.2
4.8
4.2
19.4
22.0
1.5
1.3
Bajaj Auto
Neutral
2,845
-
82,323
25,093
27,891
19.5
19.2
143.9
162.5
19.8
17.5
5.6
4.8
30.3
29.4
3.0
2.6
Bharat Forge
Neutral
1,120
-
26,074
7,726
8,713
20.5
21.2
35.3
42.7
31.7
26.2
5.9
5.3
18.9
20.1
3.5
3.0
Ceat
Neutral
1,878
-
7,596
7,524
8,624
13.0
12.7
131.1
144.3
14.3
13.0
2.6
2.2
19.8
18.6
1.1
0.9
Eicher Motors
Neutral
28,407
-
77,331
16,583
20,447
17.5
18.0
598.0
745.2
47.5
38.1
16.2
12.4
41.2
38.3
4.6
3.6
Exide Industries
Neutral
217
-
18,411
7,439
8,307
15.0
15.0
8.1
9.3
26.7
23.3
3.7
3.3
14.3
16.7
2.1
1.9
Gabriel India
Neutral
148
-
2,130
1,544
1,715
9.0
9.3
5.4
6.3
27.5
23.5
5.2
4.6
18.9
19.5
1.3
1.2
Hero Motocorp
Neutral
3,707
-
74,025
28,120
30,753
15.2
15.6
169.1
189.2
21.9
19.6
7.6
6.3
30.8
28.2
2.4
2.2
Indag Rubber
Neutral
207
-
544
286
326
19.8
16.8
11.7
13.3
17.7
15.6
3.0
2.8
17.8
17.1
1.5
1.3
Jamna Auto Industries
Neutral
264
-
2,103
1,486
1,620
9.8
9.9
15.0
17.2
17.6
15.3
3.9
3.3
21.8
21.3
1.4
1.3
JK Tyres
Neutral
167
-
3,788
7,455
8,056
15.0
15.0
21.8
24.5
7.7
6.8
1.6
1.3
22.8
21.3
0.6
0.5
L G Balakrishnan & Bros Neutral
766
-
1,202
1,302
1,432
11.6
11.9
43.7
53.0
17.5
14.5
2.5
2.3
13.8
14.2
1.0
0.9
Mahindra and Mahindra Neutral
1,390
-
86,332
46,534
53,077
11.6
11.7
67.3
78.1
20.7
17.8
3.4
2.9
15.4
15.8
1.8
1.6
Maruti
Accumulate
7,515
8,495
227,009
67,822
83,717
15.2
15.0
243.0
291.5
30.9
25.8
7.1
5.8
22.9
22.4
3.0
2.4
Minda Industries
Neutral
818
-
7,067
2,728
3,042
9.0
9.1
68.2
86.2
12.0
9.5
2.7
2.2
23.8
24.3
2.5
2.2
Motherson Sumi
Neutral
323
-
68,007
45,896
53,687
7.8
8.3
13.0
16.1
24.8
20.1
8.0
6.4
34.7
35.4
1.6
1.3
Rane Brake Lining
Neutral
1,337
-
1,058
511
562
11.3
11.5
28.1
30.9
47.6
43.3
7.3
6.6
15.3
15.0
2.2
2.0
Setco Automotive
Neutral
42
-
559
741
837
13.0
13.0
15.2
17.0
2.8
2.5
0.5
0.4
15.8
16.3
1.1
1.0
Subros
Neutral
243
-
1,459
1,488
1,681
11.7
11.9
6.4
7.2
38.0
33.9
4.0
3.6
10.8
11.4
1.2
1.0
Swaraj Engines
Neutral
2,151
-
2,672
660
810
15.2
16.4
54.5
72.8
39.5
29.6
12.3
11.2
31.5
39.2
3.9
3.2
Tata Motors
Neutral
456
-
131,706
300,209
338,549
8.9
8.4
42.7
54.3
10.7
8.4
1.7
1.4
15.6
17.2
0.6
0.5
TVS Motor
Neutral
570
-
27,094
13,390
15,948
6.9
7.1
12.8
16.5
44.7
34.5
11.1
8.8
26.3
27.2
2.1
1.7
Capital Goods
ACE
Neutral
72
-
712
709
814
4.1
4.6
1.4
2.1
51.4
34.3
2.1
2.0
4.4
6.0
1.2
1.0
BEML
Neutral
1,649
-
6,867
3,451
4,055
6.3
9.2
31.4
57.9
52.5
28.5
3.2
2.9
6.3
10.9
2.1
1.8
BGR Energy
Neutral
148
-
1,069
16,567
33,848
6.0
5.6
7.8
5.9
19.0
25.1
1.1
1.1
4.7
4.2
0.2
0.1
Stock Watch
July 26, 2017
Company Name
Reco
CMP
Target
Mkt Cap
Sales ( Čcr )
OPM(%)
EPS (Č)
PER(x)
P/BV(x)
RoE(%)
EV/Sales(x)
(Č)
Price ( Č)
( Č cr )
FY17E
FY18E
FY17E
FY18E
FY17E
FY18E
FY17E
FY18E
FY17E
FY18E
FY17E
FY18E
FY17E
FY18E
Capital Goods
Bharat Electronics
Neutral
172
-
38,519
8,137
9,169
16.8
17.2
58.7
62.5
2.9
2.8
0.5
0.4
44.6
46.3
3.7
3.3
BHEL
Neutral
145
-
35,600
28,797
34,742
-
2.8
2.3
6.9
63.2
21.1
1.1
1.0
1.3
4.8
0.9
0.6
Blue Star
Accumulate
706
760
6,756
4,283
5,077
5.9
7.3
14.9
22.1
47.4
31.9
9.2
7.8
20.4
26.4
1.5
1.3
CG Power and Industrial
Neutral
85
-
5,330
5,777
6,120
5.9
7.0
3.3
4.5
25.8
18.9
1.1
1.1
4.4
5.9
0.9
0.8
Solutions
Greaves Cotton
Neutral
166
-
4,062
1,755
1,881
16.8
16.9
7.8
8.5
21.3
19.6
4.3
4.0
20.6
20.9
2.0
1.8
Inox Wind
Neutral
129
-
2,863
5,605
6,267
15.7
16.4
24.8
30.0
5.2
4.3
1.5
1.1
25.9
24.4
0.6
0.5
KEC International
Neutral
295
-
7,591
9,294
10,186
7.9
8.1
9.9
11.9
29.8
24.8
4.4
3.8
15.6
16.3
1.0
0.9
KEI Industries
Accumulate
231
258
1,800
2,633
3,001
10.4
10.0
12.7
13.0
18.2
17.8
3.9
3.2
21.4
18.2
0.9
0.8
Thermax
Neutral
909
-
10,831
5,421
5,940
7.3
7.3
25.7
30.2
35.4
30.1
4.3
3.9
12.2
13.1
1.9
1.7
VATech Wabag
Buy
582
681
3,178
3,136
3,845
8.9
9.1
26.0
35.9
22.4
16.2
2.8
2.4
13.4
15.9
0.9
0.7
Voltas
Neutral
504
-
16,670
6,511
7,514
7.9
8.7
12.9
16.3
39.1
30.9
7.0
6.2
16.7
18.5
2.3
2.0
Cement
ACC
Neutral
1,725
-
32,396
11,225
13,172
13.2
16.9
44.5
75.5
38.8
22.9
3.7
3.4
11.2
14.2
2.9
2.5
Ambuja Cements
Neutral
268
-
53,116
9,350
10,979
18.2
22.5
5.8
9.5
46.1
28.2
3.9
3.5
10.2
12.5
5.7
4.8
India Cements
Neutral
210
-
6,482
4,364
4,997
18.5
19.2
7.9
11.3
26.6
18.6
1.9
1.9
8.0
8.5
2.2
2.0
J K Lakshmi Cement
Neutral
467
-
5,498
2,913
3,412
14.5
19.5
7.5
22.5
62.3
20.8
3.8
3.2
12.5
18.0
2.5
2.1
JK Cement
Neutral
973
-
6,802
4,398
5,173
15.5
17.5
31.2
55.5
31.2
17.5
3.7
3.2
12.0
15.5
2.1
1.8
Orient Cement
Neutral
161
-
3,293
2,114
2,558
18.5
20.5
8.1
11.3
19.9
14.2
2.9
2.5
9.0
14.0
2.2
1.7
UltraTech Cement
Neutral
4,106
-
112,713
25,768
30,385
21.0
23.5
111.0
160.0
37.0
25.7
4.7
4.1
13.5
15.8
4.6
3.8
Construction
Engineers India
Neutral
163
-
10,964
1,725
1,935
16.0
19.1
11.4
13.9
14.3
11.7
2.0
1.9
13.4
15.3
5.4
4.8
Gujarat Pipavav Port
Neutral
149
-
7,220
705
788
52.2
51.7
5.0
5.6
29.9
26.7
3.0
2.6
11.2
11.2
9.7
8.2
ITNL
Neutral
93
-
3,063
8,946
10,017
31.0
31.6
8.1
9.1
11.5
10.2
0.4
0.4
4.2
5.0
3.7
3.4
KNR Constructions
Neutral
209
-
2,940
1,385
1,673
14.7
14.0
41.2
48.5
5.1
4.3
1.0
0.8
14.9
15.2
2.2
1.8
Larsen & Toubro
Buy
1,171
1,700
163,967
111,017
124,908
11.0
11.0
61.1
66.7
19.2
17.6
2.3
2.1
13.1
12.9
2.5
2.3
MEP Infra
Neutral
127
-
2,066
1,877
1,943
30.6
29.8
3.0
4.2
42.4
30.3
20.5
13.8
0.6
0.6
2.5
2.3
Nagarjuna Const.
Neutral
91
-
5,040
8,842
9,775
9.1
8.8
5.3
6.4
17.1
14.2
1.4
1.2
8.2
9.1
0.7
0.6
NBCC
Neutral
209
-
18,824
7,428
9,549
7.9
8.6
8.2
11.0
25.5
19.0
1.3
1.0
28.2
28.7
2.3
1.7
PNC Infratech
Neutral
144
-
3,686
2,350
2,904
13.1
13.2
9.0
8.8
16.0
16.3
0.6
0.5
15.9
13.9
1.7
1.4
Power Mech Projects
Neutral
594
-
874
1,801
2,219
12.7
14.6
72.1
113.9
8.2
5.2
1.5
1.3
16.8
11.9
0.5
0.4
Sadbhav Engineering
Accumulate
284
298
4,876
3,598
4,140
10.3
10.6
9.0
11.9
31.6
23.9
3.3
2.9
9.9
11.9
1.6
1.4
Stock Watch
July 26, 2017
Company Name
Reco
CMP
Target
Mkt Cap
Sales ( Čcr )
OPM(%)
EPS (Č)
PER(x)
P/BV(x)
RoE(%)
EV/Sales(x)
(Č)
Price ( Č)
( Č cr )
FY17E
FY18E
FY17E
FY18E
FY17E
FY18E
FY17E
FY18E
FY17E
FY18E
FY17E
FY18E
FY17E
FY18E
Construction
Simplex Infra
Neutral
489
-
2,419
6,829
7,954
10.5
10.5
31.4
37.4
15.6
13.1
1.6
1.5
9.9
13.4
0.8
0.7
SIPL
Neutral
105
-
3,707
1,036
1,252
65.5
66.2
(8.4)
(5.6)
3.9
4.5
(22.8)
(15.9)
11.8
9.8
Financials
Axis Bank
Accumulate
545
580
130,562
46,932
53,575
3.5
3.4
32.4
44.6
16.8
12.2
2.2
1.9
13.6
16.5
-
-
Bank of Baroda
Neutral
165
-
37,973
19,980
23,178
1.8
1.8
11.5
17.3
14.3
9.5
1.6
1.4
8.3
10.1
-
-
Can Fin Homes
Neutral
3,087
-
8,218
420
526
3.5
3.5
86.5
107.8
35.7
28.6
7.7
6.3
23.6
24.1
-
-
Canara Bank
Neutral
357
-
21,329
15,225
16,836
1.8
1.8
14.5
28.0
24.6
12.8
1.7
1.4
5.8
8.5
-
-
Cholamandalam Inv. &
Accumulate
1,157
1,230
18,090
2,012
2,317
6.3
6.3
42.7
53.6
27.1
21.6
4.3
3.7
16.9
18.3
-
-
Fin. Co.
Dewan Housing Finance Accumulate
463
520
14,503
2,225
2,688
2.9
2.9
29.7
34.6
15.6
13.4
2.5
1.6
16.1
14.8
-
-
Equitas Holdings
Buy
168
235
5,698
939
1,281
11.7
11.5
5.8
8.2
29.0
20.5
2.5
2.2
10.9
11.5
-
-
Federal Bank
Accumulate
119
125
23,132
8,259
8,995
3.0
3.0
4.3
5.6
27.7
21.3
2.3
2.2
8.5
10.1
-
-
HDFC
Neutral
1,632
-
260,008
11,475
13,450
3.4
3.4
45.3
52.5
36.0
31.1
7.0
6.1
20.2
20.5
-
-
HDFC Bank
Accumulate
1,739
1,850
447,688
46,097
55,433
4.5
4.5
58.4
68.0
29.8
25.6
5.2
4.4
18.8
18.6
-
-
ICICI Bank
Neutral
304
-
194,890
42,800
44,686
3.1
3.3
18.0
21.9
16.9
13.9
2.3
2.1
11.1
12.3
-
-
Karur Vysya Bank
Accumulate
138
160
8,340
5,640
6,030
3.3
3.2
8.9
10.0
15.5
13.8
1.6
1.5
11.2
11.4
-
-
Lakshmi Vilas Bank
Neutral
195
-
3,739
3,339
3,799
2.7
2.8
11.0
14.0
17.7
13.9
1.8
1.7
11.2
12.7
-
-
LIC Housing Finance
Neutral
732
-
36,929
3,712
4,293
2.6
2.5
39.0
46.0
18.8
15.9
3.5
3.0
19.9
20.1
-
-
Punjab Natl.Bank
Neutral
163
-
34,675
23,532
23,595
2.3
2.4
6.8
12.6
24.0
12.9
3.7
2.6
3.3
6.5
-
-
RBL Bank
Neutral
529
-
19,927
1,783
2,309
2.6
2.6
12.7
16.4
41.7
32.3
4.5
4.1
12.8
13.3
-
-
Repco Home Finance
Accumulate
785
825
4,908
388
457
4.5
4.2
30.0
38.0
26.2
20.7
4.4
3.7
18.0
19.2
-
-
South Ind.Bank
Neutral
30
-
5,338
6,435
7,578
2.5
2.5
2.7
3.1
11.0
9.6
1.4
1.2
10.1
11.2
-
-
St Bk of India
Neutral
296
-
255,725
88,650
98,335
2.6
2.6
13.5
18.8
21.9
15.8
2.1
1.8
7.0
8.5
-
-
Union Bank
Neutral
161
-
11,082
13,450
14,925
2.3
2.3
25.5
34.5
6.3
4.7
0.9
0.8
7.5
10.2
-
-
Yes Bank
Neutral
1,614
-
73,846
8,978
11,281
3.3
3.4
74.0
90.0
21.8
17.9
4.1
3.5
17.0
17.2
-
-
FMCG
Akzo Nobel India
Neutral
1,790
-
8,585
2,955
3,309
13.3
13.7
57.2
69.3
31.3
25.8
10.2
8.6
32.7
33.3
2.7
2.4
Asian Paints
Neutral
1,152
-
110,495
17,128
18,978
16.8
16.4
19.1
20.7
60.3
55.7
21.0
19.8
34.8
35.5
6.4
5.8
Britannia
Neutral
3,856
-
46,292
9,594
11,011
14.6
14.9
80.3
94.0
48.0
41.0
19.7
15.3
41.2
-
4.6
4.0
Colgate
Neutral
1,068
-
29,060
4,605
5,149
23.4
23.4
23.8
26.9
44.9
39.7
24.9
19.4
64.8
66.8
6.2
5.6
Dabur India
Neutral
307
-
54,061
8,315
9,405
19.8
20.7
8.1
9.2
37.9
33.4
10.6
8.7
31.6
31.0
6.1
5.4
GlaxoSmith Con*
Neutral
5,489
-
23,084
4,350
4,823
21.2
21.4
179.2
196.5
30.6
27.9
8.1
6.9
27.1
26.8
4.7
4.2
Stock Watch
July 26, 2017
Company Name
Reco
CMP
Target
Mkt Cap
Sales ( Čcr )
OPM(%)
EPS (Č)
PER(x)
P/BV(x)
RoE(%)
EV/Sales(x)
(Č)
Price ( Č)
( Č cr )
FY17E FY18E
FY17E
FY18E
FY17E
FY18E
FY17E
FY18E
FY17E
FY18E
FY17E
FY18E
FY17E
FY18E
FMCG
Godrej Consumer
Neutral
997
-
67,923
10,235
11,428
18.4
18.6
41.1
44.2
24.3
22.6
5.4
4.5
24.9
24.8
6.7
5.9
HUL
Neutral
1,149
-
248,794
35,252
38,495
17.8
17.8
20.7
22.4
55.7
51.4
53.2
45.6
95.6
88.9
7.0
6.4
ITC
Neutral
291
-
354,395
40,059
44,439
38.3
39.2
9.0
10.1
32.5
28.8
9.1
7.9
27.8
27.5
8.4
7.6
Marico
Neutral
332
-
42,786
6,430
7,349
18.8
19.5
6.4
7.7
51.8
43.1
15.6
13.2
33.2
32.5
6.4
5.6
Nestle*
Neutral
6,816
-
65,721
10,073
11,807
20.7
21.5
124.8
154.2
54.6
44.2
22.4
20.2
34.8
36.7
6.4
5.4
Procter & Gamble
Neutral
8,122
-
26,366
2,939
3,342
23.2
23.0
146.2
163.7
55.6
49.6
14.1
11.7
25.3
23.5
8.6
7.5
Hygiene
Tata Global
Neutral
171
-
10,802
8,675
9,088
9.8
9.8
7.4
8.2
23.1
20.9
1.8
1.7
7.9
8.1
1.2
1.1
IT
HCL Tech^
Accumulate
895
1,014
127,644
46,723
52,342
22.1
20.9
60.0
62.8
14.9
14.2
3.8
3.2
25.3
22.4
2.5
2.1
Infosys
Buy
994
1,179
228,351
68,484
73,963
26.0
26.0
63.0
64.0
15.8
15.5
3.3
3.0
20.8
19.7
3.0
2.6
TCS
Neutral
2,571
-
506,528
117,966
127,403
27.5
27.6
134.3
144.5
19.1
17.8
5.7
5.3
29.8
29.7
3.9
3.6
Tech Mahindra
Buy
391
533
38,175
29,141
31,051
14.4
15.0
32.3
35.6
12.1
11.0
2.1
1.9
17.1
17.0
1.2
1.0
Wipro
Neutral
290
-
141,053
55,421
58,536
20.3
20.3
35.1
36.5
8.3
7.9
1.4
1.2
19.2
14.6
2.0
1.7
Media
D B Corp
Neutral
368
-
6,760
2,297
2,590
27.4
28.2
21.0
23.4
17.5
15.7
4.1
3.5
23.7
23.1
2.8
2.4
Hindustan Media
Neutral
286
-
2,102
1,016
1,138
24.3
25.2
27.3
30.1
10.5
9.5
2.0
1.8
16.2
15.8
1.3
1.1
Ventures
HT Media
Neutral
89
-
2,062
2,693
2,991
12.6
12.9
7.9
9.0
11.2
9.8
1.0
0.9
7.8
8.3
0.3
0.2
Jagran Prakashan
Buy
173
225
5,656
2,283
2,555
28.0
28.0
10.6
12.3
16.3
14.1
3.5
3.0
21.4
21.4
2.5
2.2
Sun TV Network
Neutral
815
-
32,114
2,850
3,265
70.1
71.0
26.2
30.4
31.1
26.8
8.0
7.0
24.3
25.6
10.8
9.3
TV Today Network
Buy
248
344
1,480
608
667
21.5
22.3
15.7
19.2
15.8
12.9
2.4
2.1
16.1
16.0
2.0
1.8
Music Broadcast Limited Buy
367
434
2,092
271
317
91.0
109.0
6.0
10.0
61.1
36.7
3.8
3.5
6.5
9.3
7.3
6.0
Metals & Mining
Coal India
Neutral
259
-
160,493
84,638
94,297
21.4
22.3
24.5
27.1
10.6
9.5
4.4
4.2
42.6
46.0
1.4
1.3
Hind. Zinc
Neutral
282
-
119,154
14,252
18,465
55.9
48.3
15.8
21.5
17.9
13.1
2.9
2.5
17.0
20.7
8.3
6.4
Hindalco
Neutral
220
-
49,289
107,899
112,095
7.4
8.2
9.2
13.0
23.9
16.9
1.2
1.1
4.8
6.6
1.0
0.9
JSW Steel
Neutral
215
-
51,970
53,201
58,779
16.1
16.2
130.6
153.7
1.7
1.4
0.2
0.2
14.0
14.4
1.7
1.5
NMDC
Neutral
121
-
38,331
6,643
7,284
44.4
47.7
7.1
7.7
17.1
15.7
1.5
1.4
8.8
9.2
3.6
3.2
SAIL
Neutral
64
-
26,247
47,528
53,738
(0.7)
2.1
(1.9)
2.6
24.4
0.7
0.7
(1.6)
3.9
1.4
1.3
Tata Steel
Neutral
553
-
53,718
121,374
121,856
7.2
8.4
18.6
34.3
29.7
16.1
1.9
1.7
6.1
10.1
1.1
1.1
Vedanta
Neutral
274
-
101,944
71,744
81,944
19.2
21.7
13.4
20.1
20.5
13.6
1.8
1.6
8.4
11.3
1.8
1.4
Oil & Gas
GAIL
Neutral
373
-
63,111
56,220
65,198
9.3
10.1
27.1
33.3
13.8
11.2
1.3
1.2
9.3
10.7
1.3
1.1
Indian Oil Corp
Neutral
375
-
181,999
373,359
428,656
5.9
5.5
54.0
59.3
6.9
6.3
1.1
1.0
16.0
15.6
0.6
0.6
Stock Watch
July 26, 2017
Company Name
Reco
CMP
Target
Mkt Cap
Sales ( Čcr )
OPM(%)
EPS (Č)
PER(x)
P/BV(x)
RoE(%)
EV/Sales(x)
(Č)
Price ( Č)
( Č cr )
FY17E FY18E
FY17E
FY18E
FY17E
FY18E
FY17E
FY18E
FY17E
FY18E
FY17E
FY18E
FY17E
FY18E
Oil & Gas
ONGC
Neutral
164
-
210,016
137,222
152,563
15.0
21.8
19.5
24.1
8.4
6.8
0.7
0.7
8.5
10.1
1.8
1.6
Reliance Industries
Neutral
1,603
-
521,367
301,963
358,039
12.1
12.6
87.7
101.7
18.3
15.8
1.9
1.7
10.7
11.3
2.2
1.8
Pharmaceuticals
Alembic Pharma
Buy
542
648
10,208
3,101
3,966
19.7
20.5
21.4
25.5
25.3
21.2
5.4
4.4
23.0
22.8
3.3
2.4
Alkem Laboratories Ltd
Buy
1,823
2,161
21,791
5,853
6,901
17.1
18.4
74.6
85.0
24.4
21.4
5.2
4.3
21.1
20.2
3.6
3.1
Aurobindo Pharma
Accumulate
751
823
43,994
14,845
17,086
21.5
22.1
39.4
44.7
19.1
16.8
4.7
3.7
27.6
24.7
3.1
2.7
Aventis*
Neutral
4,259
-
9,808
2,206
2,508
16.6
16.8
128.9
139.9
33.0
30.4
5.6
4.4
21.6
23.5
4.2
3.6
Cadila Healthcare
Sell
544
450
55,722
9,220
11,584
18.4
20.3
14.5
18.7
37.5
29.1
8.0
6.5
23.5
24.6
6.2
4.8
Cipla
Sell
565
461
45,424
14,281
16,619
15.4
16.2
12.5
19.7
45.2
28.7
3.6
3.3
8.4
12.0
3.4
2.9
Dishman Pharma
Sell
301
143
4,859
1,718
1,890
22.7
22.8
9.5
11.3
31.7
26.6
3.1
2.8
10.1
10.9
3.3
2.9
Dr Reddy's
Neutral
2,689
-
44,563
14,081
15,937
16.1
18.6
72.6
105.9
37.0
25.4
3.6
3.3
9.6
13.6
3.4
3.0
GSK Pharma*
Neutral
2,510
-
21,261
2,927
3,290
11.8
16.2
34.4
49.6
73.0
50.6
10.6
11.0
13.9
21.3
7.2
6.5
Indoco Remedies
Sell
204
153
1,883
1,067
1,154
12.1
14.9
8.4
11.3
24.3
18.1
2.9
2.6
12.6
15.0
1.9
1.8
Ipca labs
Buy
480
620
6,058
3,211
3,593
13.9
14.5
15.4
19.4
31.2
24.8
2.5
2.3
8.2
9.5
2.0
1.8
Lupin
Buy
1,120
1,526
50,604
17,120
18,657
24.1
24.1
56.9
61.1
19.7
18.3
3.7
3.1
20.7
18.6
3.3
2.7
Natco Pharma
Accumulate
996
1,060
17,369
2,065
1,988
33.1
33.7
27.9
25.7
35.7
38.8
10.4
8.9
29.2
22.9
8.5
8.5
Sun Pharma
Buy
567
712
135,953
30,264
32,899
29.0
26.9
32.7
31.6
17.3
17.9
3.7
3.2
22.2
18.7
4.3
3.8
Power
NTPC
Neutral
164
-
135,226
86,605
95,545
17.5
20.8
11.8
13.4
13.9
12.2
1.4
1.3
10.5
11.1
2.9
2.9
Power Grid
Neutral
216
-
113,212
25,315
29,193
88.2
88.7
14.2
17.2
15.3
12.6
2.3
2.0
15.2
16.1
9.1
8.2
Tata Power
Neutral
83
-
22,396
36,916
39,557
17.4
27.1
5.1
6.3
16.2
13.1
1.4
1.3
9.0
10.3
1.6
1.5
Real Estate
MLIFE
Buy
433
522
2,220
1,152
1,300
22.7
24.6
29.9
35.8
14.5
12.1
1.1
1.0
7.6
8.6
2.7
2.2
Prestige Estate
Neutral
250
-
9,369
4,707
5,105
25.2
26.0
10.3
13.0
24.3
19.2
1.9
1.8
10.3
10.2
3.2
2.8
Telecom
Bharti Airtel
Neutral
428
-
170,929
105,086
114,808
34.5
34.7
12.2
16.4
35.1
26.1
2.4
2.2
6.8
8.4
2.5
2.2
Idea Cellular
Neutral
98
-
35,267
40,133
43,731
37.2
37.1
6.4
6.5
15.3
15.1
1.3
1.2
8.2
7.6
1.8
1.6
zOthers
Abbott India
Neutral
4,375
-
9,298
3,153
3,583
14.1
14.4
152.2
182.7
28.8
24.0
141.1
120.5
25.6
26.1
2.8
2.4
Asian Granito
Accumulate
418
480
1,257
1,066
1,169
11.6
12.5
13.0
16.0
32.2
26.2
3.1
2.8
9.5
10.7
1.5
1.3
Bajaj Electricals
Buy
336
395
3,408
4,801
5,351
5.7
6.2
10.4
13.7
32.3
24.6
4.0
3.6
12.4
14.5
0.7
0.6
Banco Products (India)
Neutral
234
-
1,674
1,353
1,471
12.3
12.4
14.5
16.3
16.1
14.4
22.3
20.1
14.5
14.6
1.2
127.9
Coffee Day Enterprises
Neutral
247
-
5,080
2,964
3,260
20.5
21.2
4.7
8.0
-
30.8
2.9
2.6
5.5
8.5
2.1
1.9
Ltd
Competent Automobiles Neutral
235
-
150
1,137
1,256
3.1
2.7
28.0
23.6
8.4
9.9
45.1
40.8
14.3
11.5
0.1
0.1
Stock Watch
July 26, 2017
Company Name
Reco
CMP
Target
Mkt Cap
Sales ( Čcr )
OPM(%)
EPS (Č)
PER(x)
P/BV(x)
RoE(%)
EV/Sales(x)
(Č)
Price ( Č)
( Č cr )
FY17E
FY18E
FY17E
FY18E
FY17E
FY18E
FY17E
FY18E
FY17E
FY18E
FY17E
FY18E
FY17E
FY18E
zOthers
Elecon Engineering
Neutral
61
-
686
1,482
1,660
13.7
14.5
3.9
5.8
15.7
10.5
3.7
3.4
7.8
10.9
0.8
0.7
Finolex Cables
Neutral
484
-
7,399
2,883
3,115
12.0
12.1
14.2
18.6
34.1
26.0
18.1
15.8
15.8
14.6
2.3
2.1
Garware Wall Ropes
Neutral
890
-
1,947
863
928
15.1
15.2
36.4
39.4
24.5
22.6
4.4
3.8
17.5
15.9
2.2
2.0
Goodyear India*
Neutral
899
-
2,074
1,598
1,704
10.4
10.2
49.4
52.6
18.2
17.1
84.0
73.7
18.2
17.0
1.0
139.3
Hitachi
Neutral
1,999
-
5,435
2,081
2,433
8.8
8.9
33.4
39.9
59.9
50.1
48.3
40.2
22.1
21.4
2.6
2.2
HSIL
Neutral
379
-
2,740
2,384
2,515
15.8
16.3
15.3
19.4
24.8
19.5
24.6
21.2
7.8
9.3
1.4
1.3
Interglobe Aviation
Neutral
1,246
-
45,072
21,122
26,005
14.5
27.6
110.7
132.1
11.3
9.4
67.4
48.1
168.5
201.1
2.1
1.7
Jyothy Laboratories
Neutral
380
-
6,899
1,440
2,052
11.5
13.0
8.5
10.0
44.7
38.0
10.8
10.0
18.6
19.3
5.1
3.5
Kirloskar Engines India
Neutral
400
-
5,785
2,554
2,800
9.9
10.0
10.5
12.1
38.1
33.1
15.9
15.0
10.7
11.7
1.9
1.7
Ltd
Linc Pen & Plastics
Neutral
271
-
400
382
420
9.3
9.5
13.5
15.7
20.1
17.2
3.4
3.0
17.1
17.3
1.1
1.0
M M Forgings
Neutral
608
-
734
546
608
20.4
20.7
41.3
48.7
14.7
12.5
83.3
73.7
16.6
17.0
1.2
1.1
Manpasand Bever.
Neutral
783
-
4,480
836
1,087
19.6
19.4
16.9
23.8
46.4
32.9
5.6
4.9
12.0
14.8
5.1
3.8
Mirza International
Neutral
162
-
1,952
963
1,069
17.2
18.0
6.1
7.5
26.5
21.6
4.1
3.4
15.0
15.7
2.3
2.0
MT Educare
Neutral
74
-
295
366
417
17.7
18.2
9.4
10.8
7.9
6.9
1.8
1.5
22.2
22.3
0.7
0.6
Narayana Hrudaya
Neutral
299
-
6,101
1,873
2,166
11.5
11.7
2.6
4.0
112.9
75.3
6.9
6.3
6.1
8.3
3.4
2.9
Navkar Corporation
Buy
203
265
2,895
347
371
43.2
37.3
6.7
6.0
30.4
33.9
2.1
1.9
6.2
10.6
9.5
8.9
Navneet Education
Neutral
168
-
3,926
1,062
1,147
24.0
24.0
6.1
6.6
27.6
25.4
5.7
5.0
20.6
19.8
3.8
3.5
Nilkamal
Neutral
1,888
-
2,817
1,995
2,165
10.7
10.4
69.8
80.6
27.1
23.4
107.9
93.7
16.6
16.5
1.4
1.3
Page Industries
Neutral
16,720
-
18,649
2,450
3,124
20.1
17.6
299.0
310.0
55.9
53.9
372.4
284.3
47.1
87.5
7.7
6.0
Parag Milk Foods
Neutral
256
-
2,149
1,919
2,231
9.3
9.6
9.5
12.9
27.1
19.8
4.2
3.5
15.5
17.5
1.3
1.1
Quick Heal
Neutral
219
-
1,536
408
495
27.3
27.0
7.7
8.8
28.3
24.9
2.6
2.6
9.3
10.6
2.9
2.4
Radico Khaitan
Buy
129
147
1,722
1,667
1,824
13.0
13.2
6.7
8.2
19.5
15.8
1.8
1.6
9.0
10.2
1.4
1.3
Relaxo Footwears
Neutral
486
-
5,843
2,085
2,469
9.2
8.2
7.6
8.0
64.3
61.2
24.9
21.3
17.9
18.8
2.9
2.4
S H Kelkar & Co.
Neutral
277
-
4,013
1,036
1,160
15.1
15.0
6.1
7.2
45.4
38.7
4.9
4.5
10.7
11.5
3.7
3.3
Siyaram Silk Mills
Accumulate
2,321
2,500
2,176
1,574
1,769
12.5
12.7
97.1
113.1
23.9
20.5
3.7
3.2
15.4
15.5
1.6
1.4
Styrolution ABS India*
Neutral
1,089
-
1,915
1,440
1,537
9.2
9.0
40.6
42.6
26.8
25.6
68.5
62.3
12.3
11.6
1.3
1.1
Surya Roshni
Neutral
292
-
1,279
3,342
3,625
7.8
7.5
17.3
19.8
16.9
14.8
32.1
25.7
10.5
10.8
0.6
0.6
Team Lease Serv.
Neutral
1,328
-
2,270
3,229
4,001
1.5
1.8
22.8
32.8
58.3
40.4
6.3
5.4
10.7
13.4
0.6
0.5
The Byke Hospitality
Neutral
190
-
762
287
384
20.5
20.5
7.6
10.7
25.0
17.8
5.2
4.2
20.7
23.5
2.7
2.0
Stock Watch
July 26, 2017
Company Name
Reco
CMP
Target Mkt Cap
Sales ( Čcr )
OPM(%)
EPS (Č)
PER(x)
P/BV(x)
RoE(%)
EV/Sales(x)
(Č)
Price ( Č)
( Č cr )
FY17E FY18E FY17E FY18E FY17E FY18E FY17E FY18E FY17E FY18E FY17E FY18E FY17E FY18E
zOthers
Transport Corporation of
Neutral
321
-
2,459
2,671
2,911
8.5
8.8
13.9
15.7
23.2
20.5
3.2
2.8
13.7
13.8
1.0
0.9
India
TVS Srichakra
Neutral
3,682
-
2,819
2,304
2,614
13.7
13.8
231.1
266.6
15.9
13.8
413.7
325.8
33.9
29.3
1.2
1.1
UFO Moviez
Neutral
387
-
1,067
619
685
33.2
33.4
30.0
34.9
12.9
11.1
1.8
1.5
13.8
13.9
1.5
1.1
Visaka Industries
Neutral
460
-
731
1,051
1,138
10.3
10.4
21.0
23.1
21.9
19.9
59.0
55.2
9.0
9.2
1.0
0.9
VRL Logistics
Neutral
323
-
2,950
1,902
2,119
16.7
16.6
14.6
16.8
22.2
19.2
4.9
4.3
21.9
22.2
1.7
1.5
Wonderla Holidays
Neutral
352
-
1,989
287
355
38.0
40.0
11.3
14.2
31.2
24.8
4.5
3.9
21.4
23.9
6.7
5.4
VIP Industries
Buy
178
218
2,515
1,270
1,450
10.4
10.4
5.6
6.5
31.8
27.4
6.6
5.7
20.7
21.1
2.0
1.7
Navin Fluorine
Accumulate
629
730
3,097
789
945
21.1
22.4
24.0
28.7
26.2
21.9
4.2
3.6
17.8
18.5
4.0
3.2
Source: Company, Angel Research; Note: *December year end; #September year end; &October year end; Price as on July 25, 2017
Market Outlook
July 26, 2017
Research Team Tel: 022 - 39357800
DISCLAIMER
Angel Broking Private Limited (hereinafter referred to as “Angel”) is a registered Member of National Stock Exchange of India
Limited,Bombay Stock Exchange Limited and Metropolitan Stock Exchange Limited. It is also registered as a Depository Participant with
CDSL and Portfolio Manager with SEBI. It also has registration with AMFI as a Mutual Fund Distributor. Angel Broking Private Limited is a
registered entity with SEBI for Research Analyst in terms of SEBI (Research Analyst) Regulations, 2014 vide registration number
INH000000164. Angel or its associates has not been debarred/ suspended by SEBI or any other regulatory authority for accessing
/dealing in securities Market. Angel or its associates/analyst has not received any compensation / managed or
co-managed public offering of securities of the company covered by Analyst during the past twelve months.
This document is solely for the personal information of the recipient, and must not be singularly used as the basis of any investment
decision. Nothing in this document should be construed as investment or financial advice. Each recipient of this document should make
such investigations as they deem necessary to arrive at an independent evaluation of an investment in the securities of the companies
referred to in this document (including the merits and risks involved), and should consult their own advisors to determine the merits and
risks of such an investment.
Reports based on technical and derivative analysis center on studying charts of a stock's price movement, outstanding positions and
trading volume, as opposed to focusing on a company's fundamentals and, as such, may not match with a report on a company's
fundamentals. Investors are advised to refer the Fundamental and Technical Research Reports available on our website to evaluate the
contrary view, if any.
The information in this document has been printed on the basis of publicly available information, internal data and other reliable
sources believed to be true, but we do not represent that it is accurate or complete and it should not be relied on as such, as this
document is for general guidance only. Angel Broking Pvt. Limited or any of its affiliates/ group companies shall not be in any way
responsible for any loss or damage that may arise to any person from any inadvertent error in the information contained in this report.
Angel Broking Pvt. Limited has not independently verified all the information contained within this document. Accordingly, we cannot
testify, nor make any representation or warranty, express or implied, to the accuracy, contents or data contained within this document.
While Angel Broking Pvt. Limited endeavors to update on a reasonable basis the information discussed in this material, there may be
regulatory, compliance, or other reasons that prevent us from doing so.
This document is being supplied to you solely for your information, and its contents, information or data may not be reproduced,
redistributed or passed on, directly or indirectly.
Neither Angel Broking Pvt. Limited, nor its directors, employees or affiliates shall be liable for any loss or damage that may arise from
or in connection with the use of this information.